第五章 生產與成本
- 廠商的本質
- 廠商的意義與存在的理由
廠商是雇用與組織生產要素,以製造與銷售產品的一種組織。
任何交易都會產生成本,而廠商的存在是為了降低交易成本 - 廠商與產業
經濟學中的產業是為生產同類產品廠商的集合,也就是行業
例如,稻米是一個產業、每個農夫是一個廠商 - 廠商的種類
- 獨資
獨資廠商由某一個所擁有,該人身兼所有者與經營者。
獨資廠商的收入即所有者收入。 - 合夥
所有者超過一人,以及決策經由合夥人協商後執行 - 股份公司
股份公司的所有者通常是聘請專業人士擔任公司執行長(CEO)
CEO與經理人負責例行業務,重大事項經由董事會決議後執行。
董事會來自公司股東選舉得出,股東擁有公司的股票,股票是公司所有權的一種證明,在公司轉錢的利潤扣除所得稅後,用於分配利潤之用。 - 責任有限
意味著當公司破產時,所有者不需賠上自己的所有財產 - 廠商的目的
- 廠商經營的目的是利潤最大
利潤=總收入-總成本
π = TR - TC
利潤最大的意思就是盡可能的使得總成本最小,而在每一個產出水準下成本最小,就是具有效率。 - 機會成本、隱含成本與外顯成本
- 機會成本-經濟學的成本
是在面臨選擇時,所必須放棄的各種價值中最高的部分 - 隱含成本-機會成本扣除隱含成本的部分
生產者自己所提供的資本及勞務的代價 - 外顯成本(會計成本)-會計學的成本
廠商實際上付給其他廠商或個人的費用,這包括工資、地租、利息等 - 經濟利潤與會計利潤
- 會計利潤
營業收入-外顯成本=會計利潤 - 經濟利潤
營業收入-外顯成本-隱含成本=經濟利潤 - 正常利潤
經濟利潤為0時,仍有正常利潤的存在。
但嚴格來說,並不是利潤。
只是使得生產者願意繼續從事一項生產活動所必須的收入而已。
也就是隱含成本的一部分 - 廠商的資本型態
一般而言,經濟學所稱的資本,習慣上是指有形資本,使用資本的代價為利息 - 金融資本
來自自有資金-淨值融通或舉債-債務融通 - 人力資本
每個人所擁有的知識、經驗與健康,人力資本的取得要靠教育與在職訓練的加強 - 個別廠商的成本與生產
- 總成本、固定成本、變動成本與邊際成本
固定成本(FC):是在短期內,總成本之中不會隨產量的變動而變動的成本
變動成本(VC):是在短期內,會隨產量的變動而變動的成本
總成本(TC)=固定成本(FC)+變動成本(VC) - 短期與長期
經濟學習慣以資本為短期之內不會改變的生產要素(固定成本)
以勞動為可以改變的生產要素(變動成本) - 短期
是指一段時間之內,至少有一個生產要素的固定量不變 - 長期
是指一段時間之內,所有生產要素的使用量都可以改變 - 邊際成本(MC)
由總成本的變動量除以產量的變動量求得
也就是是指廠商每增加一單位產量所增加的成本
Q=產量
TC=總成本

- 平均成本或平均總成本(AC或ATC)
由總成本除以產量求得,AC=TC/Q - 平均變動成本(AVC)
由變動成本除以產量求得,AVC=VC/Q - 平均固定成本(AFC)
由固定成本除以產量求得,AFC=FC/Q 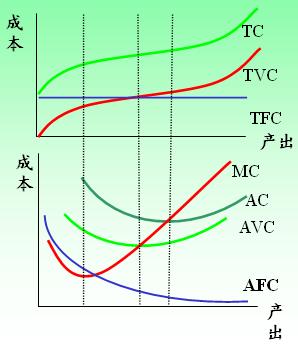
- MC、AC、AVC三條曲線是U形且MC交AC於最低點
MC交AVC於最低點 - AFC是反函數,始終處於下降趨勢
- MC曲線與AC曲線的經濟涵義和幾何涵義
- 經濟涵義
MC曲線和AC曲線都是U型的,造成這種形狀的原因都是由於投入要素的邊際成本的遞減或遞增
MC曲線與AC曲線相交於AC曲線的最低點上。
在這一點MC=AC,就是邊際成本等於平均成本。
在這一點之左:
AC在MC之上,AC一直遞減,AC>MC,就是邊際成本小於平均成本。
在這一點之右:
AC在MC之下,AC一直遞增,AC<MC,即邊際成本大於平均成本。
AC是隨MC的變動而變動的,當MC下降到一個更低點時,相應的AC也要跟著下降,但它同前面較高水平計算平均值,因此就必定大於MC,以至當MC到達最低點以後轉而遞增,在其未達到平均值時,AC仍在MC之上,並且AC仍繼續遞減,直到與遞增的MC相交,AC才到達最低點,而後轉向遞增。
而過這一點之後,情況相反,AC還是隨MC的變動而變動,當MC上升到一個更高點時,相應的AC也要跟著上升,但它同前面較低水平計算平均,因此就必定小於MC,即邊際成本大於平均成本。 - 幾何涵義
MC曲線反映的是TC曲線上的各點切線的斜率。
而AC曲線則是TC曲線上各點與原點連線的斜率。
所以MC曲線比AC曲線更早到達最低點。 - 成本與生產函數
- 生產函數
- 短期生產函數
是在技術固定與資本數量不變之下,不同的勞動投入量與產出之間的關係
L為勞動投入量
K為資本投入量,在短期狀態下,K不變 - 勞動的邊際產量
指勞動每增加一單位,總產量的增加量
MP=總產量的增加量Q/勞動的增加量L - 勞動的邊際報酬(產量)遞減→邊際成本遞增
- 勞動的邊際報酬(產量)遞增→邊際成本遞減

- 勞動的平均產量(AP)
為總產量除以勞動投入量,為AP=Q/L - 個別廠商的平均成本曲線

- 成本曲線間的關係
- 重點:
- MC線會由下往上穿越AC線與AVC線的最低點
- AC線會在AVC線的上方(因為AC=AFC+AVC)
- 當產量越來越多時,AC與AVC間的垂直距離會越來越小。
因為AC線與AVC線的垂直距離是AFC,而AFC=FC/Q,又因FC固定不變,隨著產量Q的增加,AFC會越來越小。 - 短期成本與長期成本

LRAC:長期平均成本
SRAC:短期平均成本
長期平均成本線也呈現U字型,只是比短期平均成本線更加扁平,表示廠商在長期會比短期更有產能調整的彈性。
事實上,在長期下,廠商只是在眾多短期產能之中選擇成本最小的產能而已,但是在短期,廠商只能選擇某一個產能。
所有SRAC都可能與LRAC相切於某一點 - 規模經濟、規模不經濟與固定規模經濟
LRAC說明廠商在所有生產要素(資本與勞動)都增加的情形,當所有生產要素都增加時,廠商的生產規模就增加。
- 內部規模經濟的原因
內部規模經濟(規模報酬遞增):廠商擴大規模使得LRAC下降時 - 因為分工生產與專業化的原因
- 因為生產因素間的替代關係所造成
以效率高替換效率低 - 大宗原物料的採購可以獲得優待
- 副產品的使用
- 管理費用的節省
管理費用增加的幅度小於產量的增加 - 內部的規模不經濟((規模報酬遞增))
隨著生產規模的擴大,LRAC反而上升的現象,是內部的規模不經濟
原因: - 分工專業化有其極限
- 管理成本的上升
- 生產成本的上升
在供給不變之下,需求的增加,會導致生產因素價格的上升,因而增加生產成本 - 最小有效規模:LRAC最低時的最小生產規模
- 不同產業的規模經濟
生產規模與AC之間的關係,會因為產業的不同、生產技術的改變而有所不同
如鋼鐵業的最小有效規模比家具業大 - 技術進步對平均成本的影響
生產技術進步會使得整條長期平均成本曲線往下移動

------------------------------------------------------------------------------------------------------

- Zoe is trying to decide how to divide her time between her job as a wedding photographer, which pays $27 per hour for as many hours as she chooses to work, and as a fossil collector, in which her pay depends on both the price of fossils and the number of fossils she finds. Earnings aside, Zoe is indifferent between the two tasks, and the number of fossils she can find depends on the number of hours a day she searches, as shown in the table above:
- Drive a table with price in dollar increments from $0 to $30 in the first column and the quantity of fossils Zoe is willing to supply per day at that price in the second
- If the price of a fossil is less than $6, Zoe should devote all her
time to photographybecause when the price is, say, $5 per fossil, an hour spent looking for fossils will give her 5($5) = $25, or $2 less than she’d earn doing photography. If the price of fossils is 6, Zoe should spend one hour searching, will supply 5 fossils, and will get $30 in revenue, which is $3 more than she would earn from photography. However, an additional hour would yield only 4 additional fossils or $24 additional revenue, so she should not spend any further time looking for fossils. If the price of fossils rises to $7, however, the additional hour gathering fossils would yield an additional $28, so gathering fossils during that hour would then be the best choice, and Zoe would therefore supply 9 fossils per day. Using this reasoning, we can derive a price-quantity supplied relationship for fossils as follows:

- Plot these points in a graph with price on the vertical axis and quantity per day on the horizontal.
What is this curve called? - When we plot the points from the table we derived in (a), we get Zoe’s daily supply curve for fossils:

- The supply curves for the only two firms in a competitive industry are given by P=2Q1 and P=2+Q2,where Q1 is the output of firm 1 and Q2 is the output of firm2.
What is the maket supply curve for this industry?
A:
The market supply curve (right) is the horizontal summation of the supply curves of the individual market participants (left and center).
Horizontal summation means holding price fixed and adding the corresponding quantities. Thus, at a price of $2 we add the associated values of quantity supplied for S1 (1.0) and S2 (0.0) to get the associated industry quantity supplied of 1.0. Repeating for price levels of $0, $4, and $6 generates our graphical solution.----------------------------------algebraic solutio-------------For those who prefer a more algebraic solution, you can derive the market supply curve algebraically by solving each individual supply curve for quantity and adding together the quantities.
That is, the first step is to do the following: for P = 2Q1, divide by 2 to get Q1= P/2 and for P = 2 + Q2, subtract 2 from both sides to get Q2 = P - 2.
The second step is to add together the quantities; however, pay careful attention to the region for which the supply curves don't overlap (here, the region P < 2). For the region P < 2, the market supply is the same as firm 1's supply Q = P/2 or P = 2Q. For P > 2, we add Q1 + Q2 to get Q = P/2 + (P- 2), which reduces to Q = (3P/2) - 2. Rewriting this in terms of P, we have P = (4/3) + (2/3)Q for P >2. Expressed algebraically, the market supply curve is thus P = 2Q for P < 2 and P = (4/3) + (2/3)Q for P > 2. - A price-taking firm makes air conditioners. The market price of one of their new air
conditioners is $120. Its total cost information is given in the table below:How many air conditioners should the firm produce per day if its goal is to maximize its profit?
 1. The marginal cost of each of the first 6 air conditioners produced each day is less than $120, but the marginal cost of the 7th air conditioner is $140. Therefore, the company should produce 6 air conditioners per day.
- The Paducah Slugger Company makes baseball bats out of lumber supplied to it by Acme Sporting Goods, which pays Paducah $10 for each finished bat. Paducah's only factors of production are lathe operators and a small building with a lathe. The number of bats per day it produces depends on the number of employee-hours per day, as shown in the table below.

3-1:
If the wage is $15 per hour and Paducah's daily fixed cost for the lathe and building is $60, what is the profit-maximizing quantity of bats?
As indicated by the entries in the last column of the table below, the profit-maximizing quantity of bats is 20 per day, which yields a daily profit of $35. - What would Paducah's profit-maximizing level of output be if the government imposed a tax
of $2 per bat? (Hint: Think of this tax as a $2-per-bat increase in the firm's marginal cost.) Why
do these two taxes have such different effects?
A:
A tax of $2 per bat has exactly the same effect as any other $2 increase in the marginal cost of making each bat. As we see in the last column of the table below, the company’s profit-maximizing level of output now falls to 15 bats per day. At that level it earns exactly 0 profit, but at any other level of output it would sustain a loss.
If the government imposes a tax of $10 per day on the company, then the company will have to pay the same amount each day regardless of how many bats it produces. In other words, the tax will increase the company’s fixed cost, and as a result, it will not affect the company’s profit-maximizing level of output. On the other hand, if the government imposes a tax of $2 per bat, then the marginal cost of producing each bat will increase, and as a result, the profit-maximizing number of bats will fall.
- How would each of the following affect the U.S. market supply curve for corn?
- The government taxes sodas sweetened with high-frutose corn syrup
A:
not shift. The tax on soda sweetened with high-fructose corn syrup will reduce the demand for corn, thereby lowering the price farmers receive for their corn making. As a result, farmers will reduce the quantity of corn supplied (a movement along the supply curve). - The opportunity cost of farmer's time increases.
A:
shift to the left. Higher opportunity cost for farmers means that the cost of production is higher, reducing the number of farmers producing corn. - Scientists discover that corn consumption improves performance on standardized tests.
A:
not shift. The discovery is likely to increase the demand for corn, which will bring up the price of corn and thereby increase the quantity of corn supplied (a movement along the supply curve). - The price elasticity of supply for basmati rice(an aromatic strain of rice) is likely to be which of the following?
A:
Higher in the long run than the short run, because farmers cannot easily change their decisions about how much basmati rice to plant once the current crop has been planted.
Because it takes time for producers to switch from one activity to another, the price elasticity
of supply will be higher for most goods in the long run than in the short run. - What are the respective price elasticities of supply at A and B on the supply curve shown in the accompanying figure?

A:
The expression for supply elasticity is." P/Q * 1/斜率"
Using the information in the graph, the slope of the graph can be obtained by dividing the vertical difference between A and B ($2) with the horizontal difference (3 units). The slope of the supply curve is then 2/3.


3-2:
What would be the profit-maximizing number of bats if the firm's fixed cost were not $60 per day but only $30?
The same quantity as in part a, but now profit is $65, or $30 more than before
3-3:How would Paducah's profit-maximizing level of output be affected if the government imposed a tax of $10 per day on the company? (Hint: Think of this tax as equivalent to a $10 increase in fixed cost.)
A:
A tax of $10 per day would decrease Paducah’s profit by $10 per day at every level of output. But the company would still maximize its profit by producing 20 bats per day. A tax that is independent of output does not change marginal cost, and hence does not change the profit-maximizing level of output.

沒有留言:
張貼留言